Ram Kumar

Data Analyst Portfolio

Hi, I’m Ram Kumar.

Data Analyst | Business Intelligence | Dashboarding

Experienced Data Analyst with 5+ years of expertise in Business Intelligence, Data Analytics, Dashboard Development, and Reporting Automation, complemented by 9+ years of overall professional experience. Adept at transforming raw data into meaningful insights through interactive dashboards, advanced analytics, and automated reporting solutions. Hands-on experience in Power BI, DAX, Power Query, SQL, Advanced Excel, ETL, Data Modeling, Data Visualization, KPI Reporting, Business Intelligence, and Performance Analytics. Proven ability to partner with business stakeholders, understand complex requirements, optimize reporting processes, and deliver scalable, data-driven solutions that improve decision-making, operational efficiency, and business performance.

I build insights with |

About

Profile

I specialize in creating business intelligence solutions using Power BI and Excel. I build automated dashboards, KPI reporting, churn/performance insights, and help teams make decisions faster.

  • Power BI dashboards (DAX, Power Query, data modeling)
  • Automation & reporting efficiency improvements
  • Cross-functional stakeholder collaboration

What I deliver

Dashboards

KPI views with drill-down

Insights

Trends, churn & drivers

Automation

Daily/weekly/monthly reporting

Collaboration

Clear stakeholder updates

Skills

Core Skills

Power BIAdvanced
Advanced ExcelAdvanced
DAXAdvanced
Power QueryAdvanced
Data ModellingAdvanced
SQLIntermediate

Toolbox

Power BI Desktop Power BI Service Data Cleaning Automation MS Access Pivot Tables VLOOKUP KPI Analysis Churn Analysis Forecasting (Basic) Dashboards Reporting

Highlights

  • Built 12+ dashboards and automated reporting to reduce manual effort
  • Strong stakeholder communication and operational reporting support

Projects

Zomato Sales Analytics Dashboard

Power BI
Zomato dashboard preview

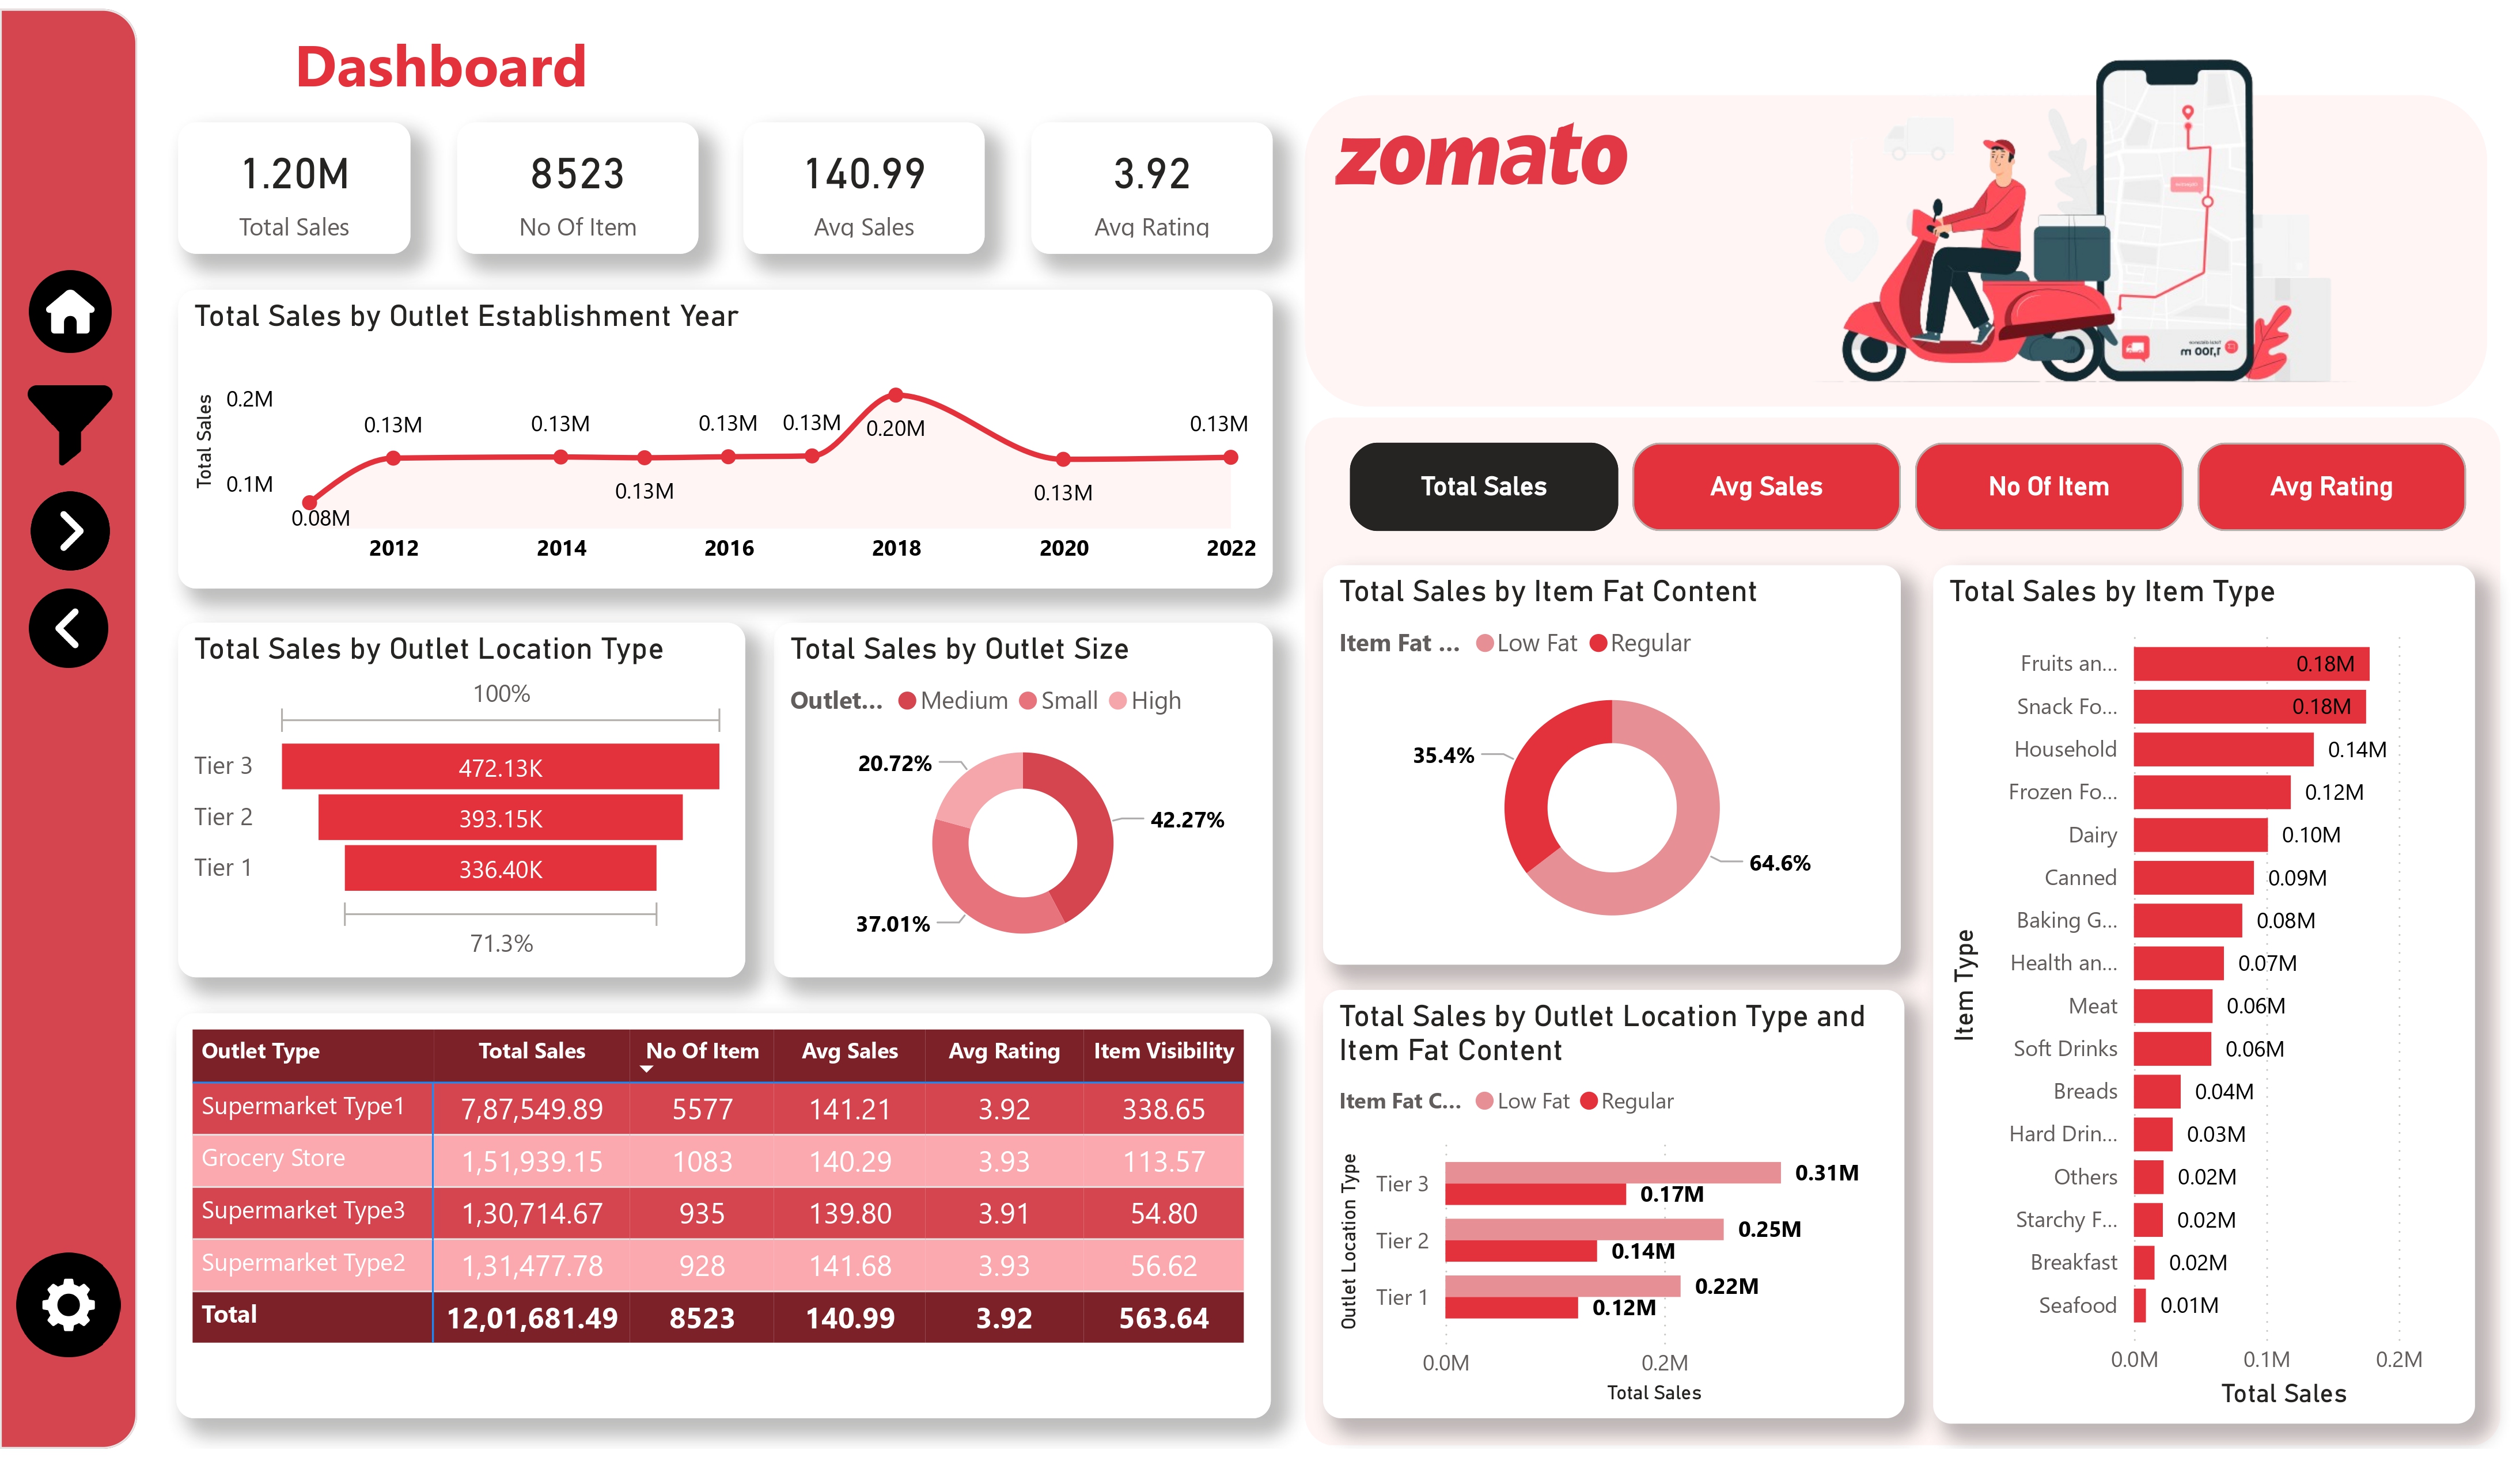
Built an interactive Power BI Sales Analytics Dashboard to analyze sales performance, outlet distribution, product categories, customer ratings, and revenue trends. Implemented DAX measures, Power Query transformations, and dynamic slicers to track key business KPIs such as total sales, average sales, average ratings, and outlet performance. Enabled stakeholders to identify top-performing products, optimize sales strategies, and make data-driven business decisions.

Samsung Supply Chain & Logistics Dashboard

Power BI
Madhav ecommerce dashboard preview

Developed a comprehensive Power BI Supply Chain & Logistics Dashboard to analyze supplier performance, inventory management, shipment operations, and customer revenue. Implemented DAX measures, Power Query transformations, and an optimized data model to track key business KPIs such as revenue, profit margin, inventory value, shipment delays, and perfect order rate. Enabled decision-makers to identify operational bottlenecks, optimize inventory levels, improve supplier efficiency, and support data-driven business decisions.

Active Customer Base Analysis

Power BI
HR analytics dashboard preview

Developed a Power BI dashboard to monitor active subscriber base trends, new activations, deactivations, and customer lifecycle stages. Implemented DAX measures to track monthly growth rate, churn-adjusted active base, and revenue contribution. Enabled data-driven decisions to optimize customer engagement and retention strategies.

Experience

Senior Data Analyst

Shyam Spectra Pvt. Ltd., Gurgaon • Jun 2024 – Present
  • Designed and deployed 12+ Power BI dashboards analyzing 500K+ records for telecom KPIs — customer churn, active base, revenue trends — used daily by 20+ stakeholders including CXO-level.
  • Built ETL pipelines using Power Query to ingest, clean, and transform raw CRM Excel data into structured star schema models, reducing data prep time by 40%.
  • Automated daily/weekly/monthly MIS reports using Excel Macros and Power Automate, reducing manual reporting effort by 30% and eliminating human error.
  • Developed advanced DAX measures including YTD/MTD calculations, churn rate, retention %, ARPU, and rolling averages for telecom performance monitoring.
  • Conducted customer churn & KPI analysis enabling targeted retention campaigns — insights contributed to a 15% reduction in monthly churn rate.
  • • Applied Row-Level Security (RLS) in Power BI Service to restrict data access by region and role for 5 business verticals.

Tools: Power BI Desktop, Power BI Service, Power Query, DAX, MS Access, Advanced Excel

Data Analyst Team Lead

DEN Networks Ltd., New Delhi • Sep 2022 – Jun 2024
  • Led a team of 3 analysts managing MIS reporting for 900+ local cable operators across Delhi NCR — delivering daily KPI dashboards to Area Managers.
  • Created automated Excel dashboards with Macros and Power BI reports for Area Manager performance tracking, reducing report generation time by 25%.
  • Designed Power BI reports with drill-through, slicers, and dynamic filters for subscriber base monitoring, churn tracking, and revenue analysis.
  • Provided daily performance insights and trend analysis to operations and senior leadership, supporting strategic business decisions.

Tools: Power BI Desktop, Power Query, DAX, Microsoft Excel, SQL, VLOOKUP, Pivot Tables, Data Modeling

Data Analyst Executive

Om Logistics Ltd., New Delhi • Feb 2019 – Sep 2022
  • Built interactive Excel & Power BI dashboards tracking logistics KPIs — delivery timelines, route efficiency, warehouse utilization — for senior leadership review.
  • Analyzed trends in logistics operations using Pivot Tables, VLOOKUP, and SQL, identifying process bottlenecks and recommending improvements that saved 10+ manual hours weekly.
  • Supported IT and Business System Analysts with performance data monitoring and ad hoc MIS reporting across 3 business units.
  • Standardized data cleaning procedures for supply chain datasets, improving data accuracy by 20% across reporting pipelines.

Tools: MS Excel, Power BI, VLOOKUP, Pivot Tables

Audit Executive

Sohanlal Commodity Management Pvt. Ltd., New Delhi • Apr 2017 – Feb 2019
  • Conducted stock quality audits for 550+ warehouses per month, ensuring 100% compliance with inventory management standards.
  • Generated daily, weekly, and monthly audit reports using Advanced Excel (Pivot Tables, VLOOKUP, IF formulas), reducing reporting time by 20%.
  • Designed management presentation reports summarizing audit findings for senior leadership review, enabling data-driven corrective action.

Tools: MS Excel, VLOOKUP, Pivot Tables

Achievements

  • Best Employee of the Month — DEN Networks Ltd.
  • Best Employee of the Month — Sohanlal Commodity Management Pvt. Ltd.

Education

Bachelor of Arts (B.A)

Delhi University — School of Open Learning (DU-SOL)

Schooling

  • CBSE — Class 12 (2014)
  • Class 10 (2012)

Certifications

Basic SQL

Great Learning

Advanced Excel

NIIT

Contact

Quick contact


Location: New Delhi, India

Message form